At EFI, we support projects which use creative and innovative approaches to tackling the challenges and opportunities posed by an increasingly data-driven world. EFI champions approaches to teaching about data which are engaging, exciting and impactful. Dr Glenna Nightingale’s creative approach to teaching about statistics through animation does just that.
Statistics by stealth
Any novice statistician will know that learning about data analysis can be intimidating. Not only are abstract statistical concepts often hard to grasp, traditional teaching and resources can feel boring and inaccessible. Finding creative ways to teach about data and statistics can help students get excited about data, without them even realising they’re doing it!
Teaching through storytelling
Human beings shape our experiences through storytelling. Stories help us make sense of the world and we have rich oral and written traditions which demonstrate that we are uniquely adapted to understand information that’s presented through story.
Applying storytelling principles to teaching can help complex concepts become clearer, as we fit them into a coherent narrative structure in our minds. We’re also more likely to remember information that’s presented to us in the form of a story – something that’s key for students looking to acquire and retain important statistical knowledge for the future.
The case of the defective biscuits
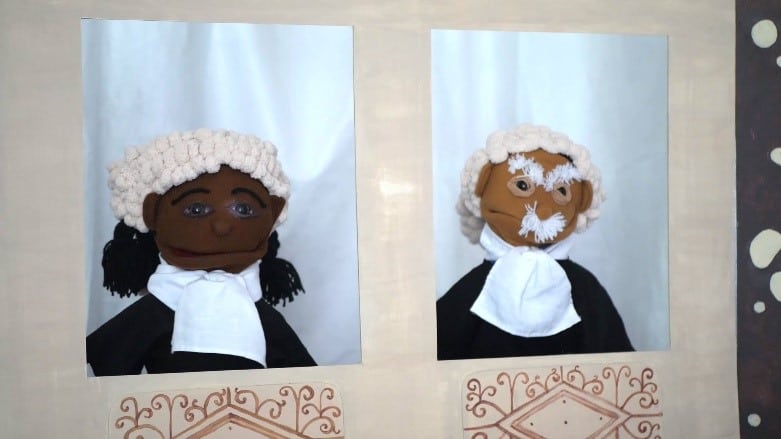
The case of the defective biscuits (see snapshot below) is a short, animated video which draws upon the principles of a classic “whodunnit” narrative to make complex statistical concepts relevant and interesting to students.
In the video, the biscuit monster stands on trial, accused of causing an increase in the proportion of defective biscuits produced in the factory where he works as a line manager. Example data visualisations are provided in an attempt to indite the biscuit monster to the crime, and this evidence is cross-examined to exemplify the considerations which must be made when interpreting data outputs.
The trial reaches an exciting conclusion, with the barrister for the defence arguing for the biscuit monster to be acquitted, based on the reasonable doubt that lies within the analysis presented by the prosecution. Viewers are encouraged to reflect on whether they would find the defendant guilty or not based on the statistical evidence.
Why biscuits?
The video is fun and light-hearted, but at its core is the key knowledge students need to acquire to understand the data visualisations presented. Dr Nightingale is passionate about making learning about statistics exciting and the playful nature of The case of the defective biscuits offers students a less daunting way to engage with complex statistical principles than they might have encountered through more traditional teaching methods.
Dr Nightingale has also created a number of other short video explainers for data and statistical concepts, such as confidence intervals, zones of influence and ANOVA. She hopes the bite-sized format of these will appeal to viewers wanting a quick and exciting dose of statistical clarity. She has built various R Shiny apps (http://www.glennanightingale.com/stats-clinic.html) that allow beginners to access basic statistical concepts. She is also exploring the development of a game (using the Unreal game engine) which would incorporate underlying statistical concepts, but still afford the user the excitement and self-directed exploration of a typical video game.
Conclusion
This project embraces creative approaches to supporting learning about data. Resources like this help equip students for their future in a data-driven world and break down the barriers which make statistics seem sterile and inaccessible.
Researcher profile
Dr Glenna Nightingale is a Chancellor’s Research Fellow in the School of Health in Social Science. Her research interests point process modeling, developing quantitative methods for epidemiology and public health, evaluating complex public health interventions and using creative techniques to make learning about statistics exciting and motivating.
Copyright & open licence
All these videos are intended to be shared, reused, and remixed. In order to encourage this, the authors have applied a Creative Commons open licence.
The requirements are to include the following attribution, not use the material for commercial purposes and if you remix the material, you must distribute your contributions under the same license as the authors.
Attribution (20 second animations):
By Glenna Nightingale and Jacqueline Aim.
Copyright © University of Edinburgh 2021 CC BY-NC-SA
This work is licensed under a Creative Commons Attribution-NonCommercial-ShareAlike 4.0 International License.
Attribution (short film):
By Glenna Nightingale and Emily Beaney.
Copyright © University of Edinburgh 2021.
Download the videos
Dedicated Media Hopper Create channel
Conveying statistical concepts through animation and data storytelling / Digital Learning Applications and Media by blogadmin is licensed under a Creative Commons Attribution CC BY 3.0