In 2018, a Centre for Future Infrastructure Briefing Note explored the challenge of meeting road safety global goal targets [1].
Target 3.6 is that “By 2020, halve the number of global deaths and injuries from road traffic accidents”. The quality of our infrastructure is part of the system that contributes to that [2]. We now have four years of road safety data for the UK since that target was agreed by all 193 UN nations in September 2015. How are we doing so far?
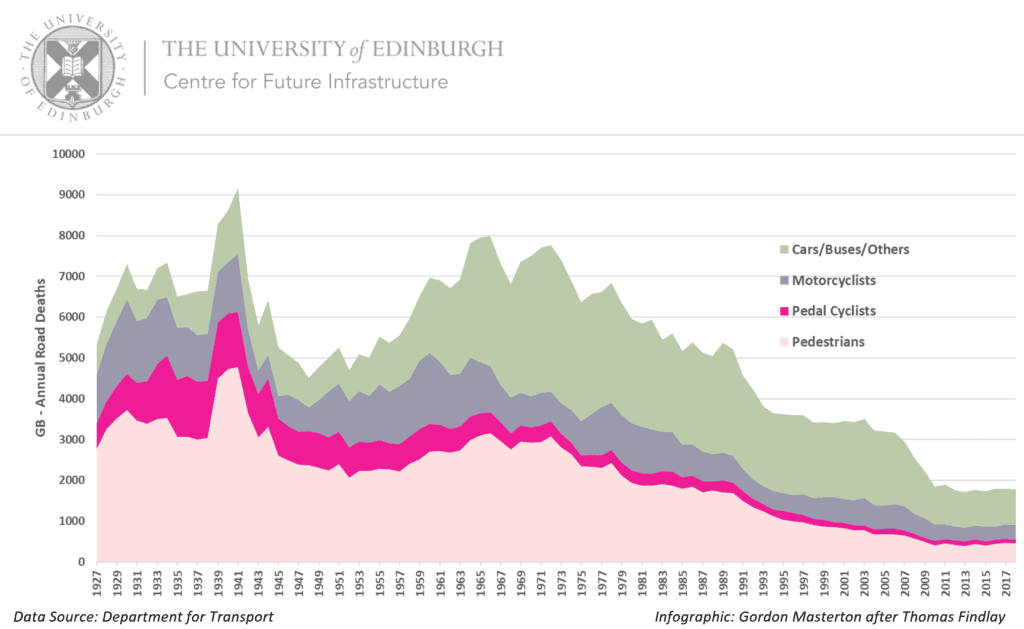
Fig 1 shows Great Britain’s road traffic deaths from 1927 to 2018.

Figure 1 Great Britain – road traffic accident deaths 1927-2018
Numbers of deaths were trending downwards from the 1970s until 2010. Since then, improvement has completely stalled.
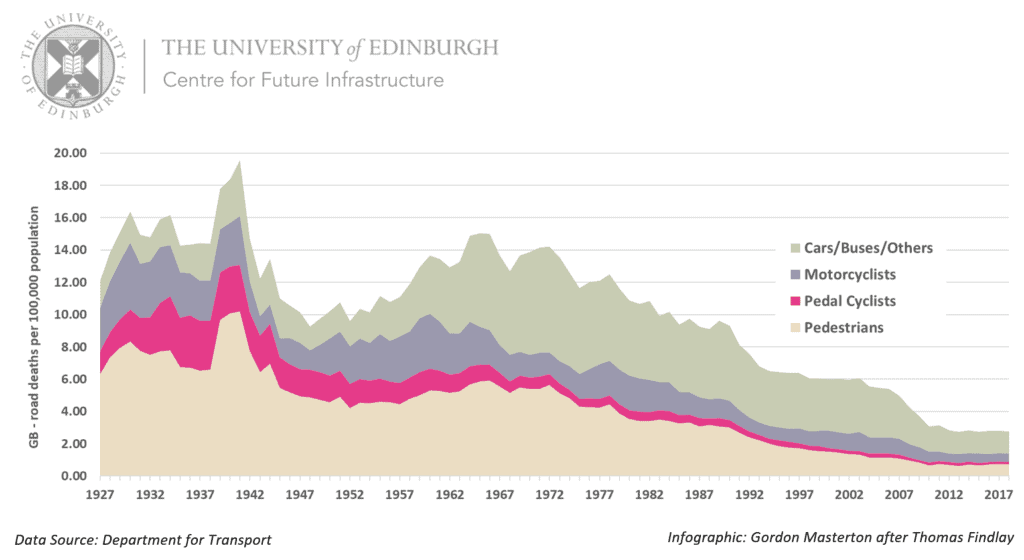
Fig 2 shows the same road death data normalised for GB population. The pattern is similar. There has been an increase in population since 2010 but it does not account for the dramatic slowdown in improvement since 2010.

Figure 2: Great Britain – road traffic accident deaths per 100,000 population 1927-2018
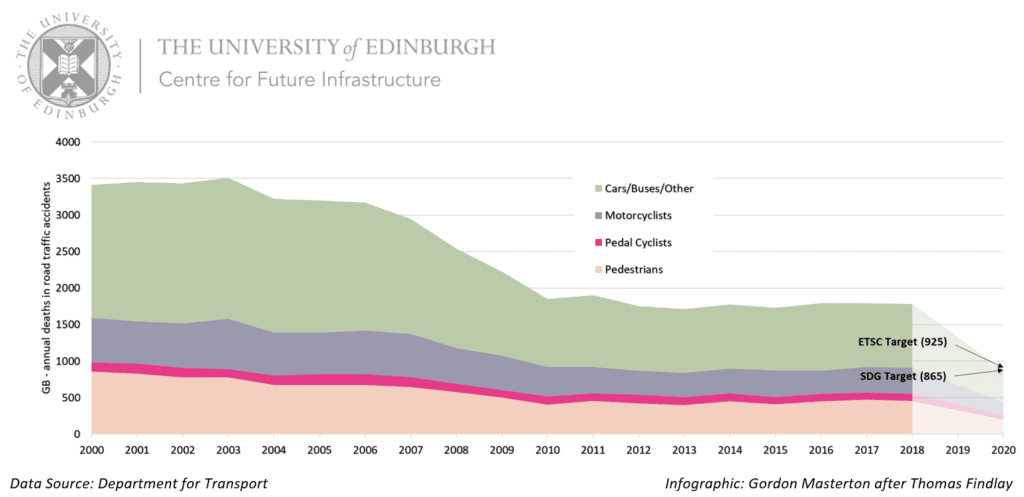
Let’s look more closely at recent years and return to number of deaths (the metric chosen for the Global Goal target). The plateau in GB road safety performance since 2010 is clear. (Fig 3).

Figure 3: Great Britain – annual road traffic accident deaths 2000-2018 and targets for 2020
Fig 3 also projects forward to 2020 and identifies two targets. The SDG target is 865 deaths (half the number in 2015). The other target shown is the European Union’s, which committed to reducing road deaths by 50% from a 2010 baseline by 2020 (equivalent to 925 deaths for the UK)[3]. It is marginally less stretching than the SDG Target. It is now abundantly clear that a sharp improvement on 2010-18 performance is required if we are to meet either target.
The House of Commons International Development Committee said in June 2016: “We are particularly concerned that the SDGs have not been included in the 2015–2020 Single Departmental Plans of all government departments, which indicates a worrying lack of engagement in the SDGs across Government.”[4].
Whilst Highways England has a target for Killed and Seriously Injured on the Strategic Road Network in 2020 to be 40% less than the 2005-9 average baseline [5] the Department for Transport currently has set no targets for overall road safety. It has recently committed to review research on road safety performance indicators and targets to establish if there is any evidence to support their effectiveness [6]. Comparing past performance with periods which have had targets and periods which have not, would be a good place to start.
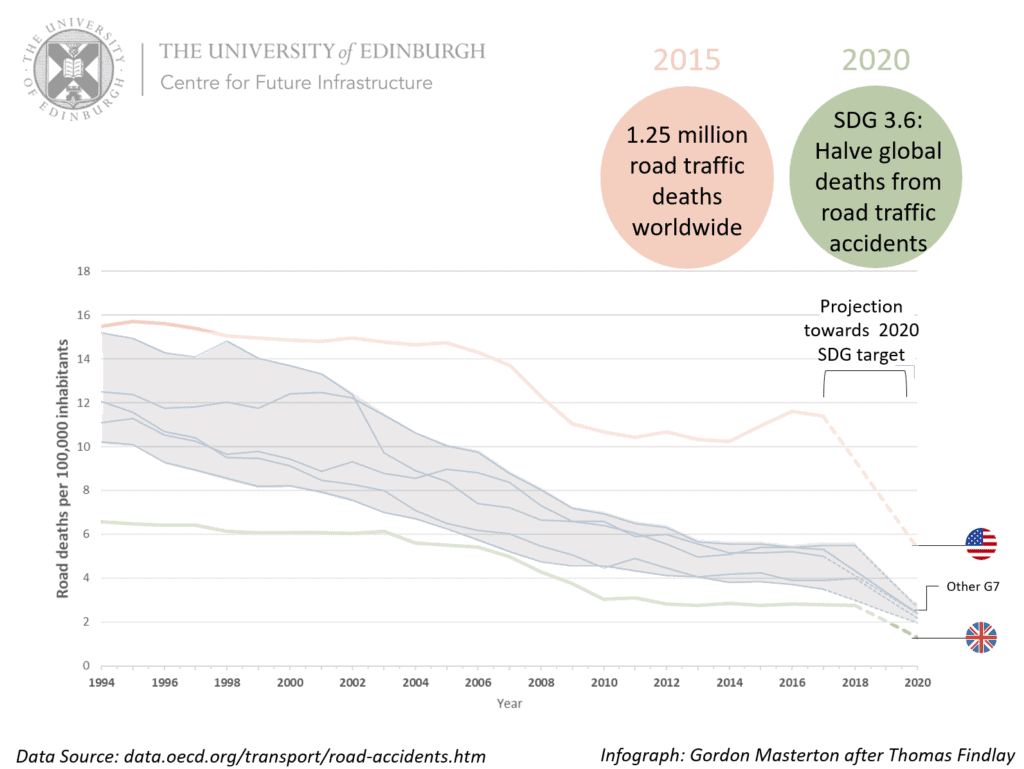
How are we benchmarked against our peers? From OECD data [7], UK road safety death rate per inhabitant has been consistently better than the other G7 countries between 1994 and 2018 (Fig 4), although the performance gap has been narrowing.
The slowdown in improvement since 2010 is evident for the UK and USA, and it appears to be mirrored in other G7 countries, although beginning a few years later.
To halve the number of deaths between 2015 and 2020 would have required a 15% improvement each year. In the time that’s left, the UK improvement would now need to be 40% per annum. All G7 countries are trending to miss the target, with the USA facing the biggest challenge. The UK has failed to improve since the SDG targets were announced. The data suggest that we are fast running out of time to reduce fatalities at all since 2015, never mind halving them.

Figure 4: G7 Countries – road deaths 1994 to 2017/18
Is there any realistic prospect of hitting the SDG target, or even the ETSC target? Last year we said: “Perhaps, but only with a strong commitment to succeed and a recognition of the social and economic importance of reducing avoidable deaths on a large scale, which in turn requires inspired leadership from industry and policy-makers[8].”
There has been no evidence of improvement or of any strong commitment to deliver this Global Goal. Increasingly, it looks like being a Global Own Goal for the UK and all the G7 countries.
Why does this matter? Road traffic injury is now the leading cause of death for children and young adults aged 5–29 years. More people now die as a result of road traffic injuries than from HIV/AIDS, tuberculosis and diarrhoeal diseases [9].
If UK road deaths occurred in a single incident each year, every year, the national outcry over 1800 or so avoidable deaths would be deafening. Aside from the lack of moral leadership to developing countries, and the unquantifiable loss to grieving families and friends, there is a wider economic cost. The average cost of a road safety fatality in the UK has been assessed at £2.2m and total costs from reported road accidents amounted to £16.5bn in 2018 [10].
Using these figures, the failure to reduce road traffic deaths and injuries by 15% each year since 2015 has already cost the UK some £9.9bn between 2016 and 2018 (the delta between the actual and targeted reduction) and if trends continue, will have cost the UK £25bn by 2020. The value of investing a fraction of that in technology improvements, more intensive policing, public advertising, research into the causes of the poor performance, under impassioned and focussed leadership would have a very good chance of achieving a substantial reduction in these avoidable costs
Footnotes
1.Road Safety – the UK’s Lack of Progress towards Global Goal Target 3.6. Infrastructure Global Goals Briefing Note 3. Centre for Future Infrastructure, University of Edinburgh, November 2019.
2.Infrastructure performance indicators – a new approach based on the Sustainable Development Goals. Masterton, G.G.T., Findlay, T., Wright, M. and Smith, S.D. International Symposium for Next Generation Infrastructure, London, 2017.
[3] Road Safety Performance Index (PIN) Report. European Transport Safety Council. 2017.
[4] UK implementation of the Sustainable Development Goals First Report of Session 2016–17. House of Commons International Development Committee. June 2016.
[5] Highways England Operational Metrics Manual. January 2018.
[6] The Road Safety Statement 2019. UK Department for Transport. 2019
[7] International Transport Forum: International Traffic Safety Data and Analysis Group (IRTAD) Road Safety Annual Report 2019: https://www.itf-oecd.org/road-safety-annual-report-2019accessed 8 Nov 2019.
[8] Road Safety – A Sustainable Development Own Goal for the UK? Infrastructure Global Goals Briefing Note 1. Centre for Future Infrastructure, University of Edinburgh, January 2018
[9] Global status report on road safety 2018. Geneva: World Health Organization; 2018. Licence: CC BYNC-SA 3.0 IGO..
[10] Average cost of road accidents in Great Britain 2018, by severity. “https://www.statista.com/aboutus/our-research-commitment”>N. Sönnichsen statista.com. Oct 18, 2019.

Prof Gordon Masterton
Centre for Future Infrastructure, Edinburgh Futures Institute, The University of Edinburgh. 2019.


