Gaelic Handwriting Recognition Project
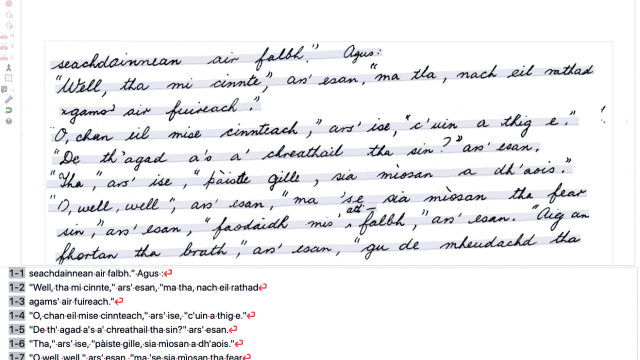
The Gaelic Handwriting Recognition Project is converting 500k words of traditional narrative documents to digital text and training the first automatic handwriting recogniser for the Gaelic language, using the Transkribus platform.